Description:
Overgrown is a fast-paced resource management game in which players have to keep their multitude of houseplants alive. The player will do this in a succession of short and increasingly difficult levels until they become a master gardener capable of anything those pesky plants require. With short and fast gameplay sessions, Overgrown provides highly engaging gameplay at all times whenever the player feels like playing.
Overgrown was created by Tiny Moose Studio as a project in Unreal Engine 4 for our Senior Production Class
Tiny Moose Studio:
Producer: Ian Kehoe
Lead Designer: Ariana Cook
Lead Programmer: Simon Steele
Lead Artist: Faith Scarborough
Level Designer: Ryan Swanson
Programmer: Adam Clarke
Programmer: Jason Gold
Environment Artist: Tessa Nelson
2D Artist: Hannah Mata
On Overgrown I primarily worked on Level Design and gameplay balancing
Level Design:
On this project, I was tasked to create and maintain level content. Over the course of the project, I created 10 new levels rounding out the level total to 12.
Concepting:
Before each level is built I do some initial planning for how I want each level to look. For this, I use an Isometric tool called Icograms. This allowed me to create a rough sketch of the basic layout and design for that level, which I will then use as a reference for when I start working on building the level in Unreal.
White-Boxing:
Once the sketch is complete I then move to create the playable space in Unreal. In white-boxing I first like to work on creating the bones of the level. Using the sketch I add in the floors and accompanying walls. I then add in the windows and the lights to get a better sense of where the light sources for the level are. Finally, I add in the essential spatial props like the tables, chairs, cabinets, beds, dressers, etc. These props either are used to place plants on top of and or to set up the flow of movement.
Build Level Functionality:
After the white box is complete, I can focus on making the level fully playable and functional by adding drop zones, plants, cats, cameras, and any level-specific settings. In bigger levels, this may also involve custom scripting of interactions in the house depending on the layout. The goal at the end of this process is to have a level that is ready for someone to test and give feedback on.
Art Pass:
At this point, the level will have minimal art assets in it and will take a few rounds of art passes will need to take place to add art assets in to make the environment feel more like a fully furnished house.
Testing / Iterating:
Once the functionality is complete begins the iterative cycle of design. Feedback from the team and from our testers leaks to constant tweaks in layout and balance to make sure the levels are fair and play as intended.
Game Balance:
Early on in the project, we identified the need to create a tool that outputs player data (player actions, plant information, level score, etc) to a data file. This allows our testers to directly upload that data log in our testing forms. I would then compile all the data into a Google Sheet spreadsheet to further analyze and compare. This process took a lot of manual effort each week to upload all tester data. Early on I wrote some custom functions in Google Apps Script to speed up the process but the time to upload the data, run all the scripts, then further break up the individual-level data was still quite high sometimes taking about 3 hours depending on how many testers played in a given week.
To solve this issue, I decided to continue to use Google Apps Script to automate most of the grunt work. What this resulted in was the file uploads from the testing session would immediately be added to the google sheets file, and run all the data collection scripts on the data logs as soon as a tester completed their testing form.
Here's how this all works.
Every time a form is submitted it runs the function above. This function gets the range of data from the form response spreadsheet and gets the value of the row where the last data was added or the data from the tester that just submitted. I use that value to figure out what cell row to grab the file from. When a file gets uploaded to a form, it uploads it to your drive and outputs its drive URL to the cell. So the data is in the drive, but it's not actually imported into the spreadsheet. Each drive URL link contains the ID of the file, an ID I can use to search through the drive and find the file by isolating the ID from the URL. Because the data logs are uploaded as CSV files, once I find the file in the drive I can parse through the CSV and store it in an array. Basically, this just copies all the data from the CSV file into a variable I can use to write the data to a new sheet. (See Function Below)
This creates a new sheet labeled with this tester number and pastes it into the newly created sheet, allowing me to be able to run my data collection scripts on that sheet and jump-starts the data analysis process.
The Data Output logs generally look like the image below. Depending on how many levels the testers played this log could be anywhere from 100 to 400 lines of pure data. Our data output log collects almost every action a player does in a given level aside from their movement, but it's not all relevant information. We are only looking to collect data from levels players finished in order to gather the most accurate information from their play sessions and compare it to other testers.
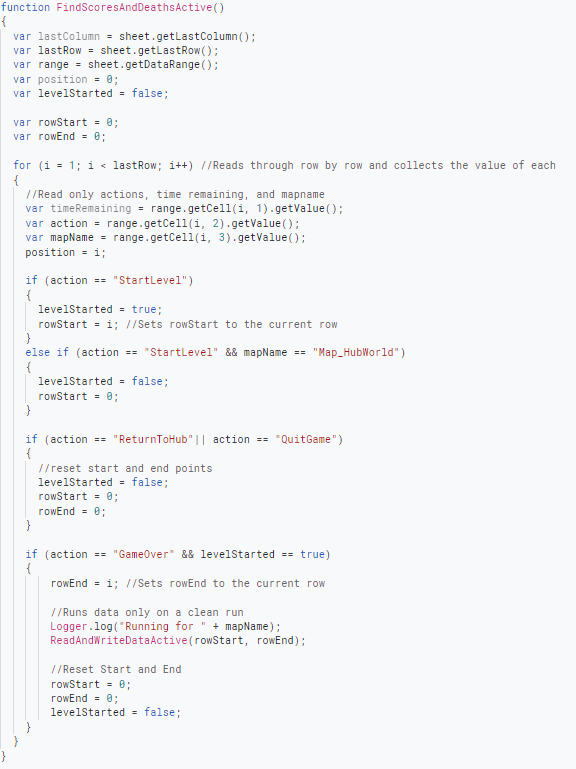
At first, I was manually parsing through all this information. This meant looking through the data and extracting only completed level data for each tester than copying all their combined data into 1 single sheet so each level's data can be compiled and analyzed. Overall this was a lengthy and inefficient process, so I looked into creating custom functions with Google Apps Script to do all this manual work for me and save a lot of time and effort (See Below).


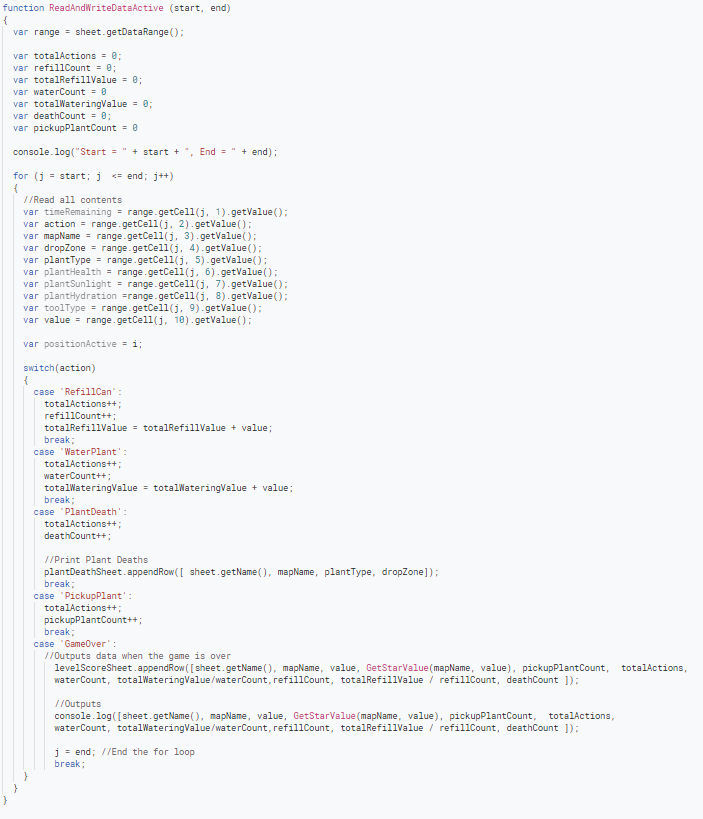
Essentially how this all works is that it first parses through the data looking a complete range of data. When it finds a complete range it sends that range to the ReadAndWrite function to do a full breakdown of that level's data and outputs all the collected data to a specific sheet. Once all the tester data is in that sheet, it then gets manually separated by level to further analyze and compare against the other tester's data.
Below is what all the tester data from a given level looks like. This information gives me a well-painted picture of how different players are performing in each level. Going even deeper, I can even compare the averages across all levels against each other to get a sense of the difficultly of the levels


Ultimately this information gives me a good understanding of how players perform in each level and helps me figure out how to make meaningful changes to our systems to balance the play experience.
If you are interested in checking out Overgrown you can download the game on Steam - https://store.steampowered.com/app/1594950/Overgrown/